Notes on Using the Graphs
The following graphs illustrate the mechanical values for all disc springs made to DIN 2093 specifications, as well as the Christian Bauer Works Standards Range. The complete charts with graphs are displayed clicking on each disc springs measure.
The left-hand portion of each of the charts illustrates the particular load/deflection characteristics of the each disc spring, while on the right side portion the data is printed in table form.
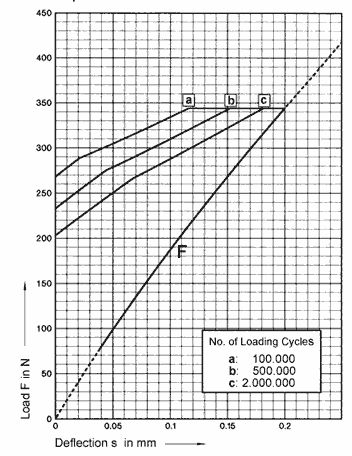
Figure 35
Example
For each individual disc spring which has been illustrated, the cb part number is shown in the heading and, when applicable, the additional information regarding the disc spring's classification in DIN 2093 as a Series A, B or C example is included.
The calculated load/deflection cu rve ha s been ma rked with F. The spring deflection is the Absissa while the disc spring load is the Ordinate. The beginning and the end of each curve have been marked with broken lines to indicate that, in dynamic loading applications, a minimal pre-stress deflection value of s = 0.15 ho should be utilized (See Section 8.2.1) and that, as the disc spring begins to approach the flat position, a strongly progressive load curve occurs which is not mathematically calculable and which deviates markedly from the theoretical (see Section 5). Each disc spring curve characteristic has been calculated to the value s = ho' meaning that, for disc springs with load-bearing surfaces and a correspondingly reduced material thickness, the true flat condition is not achieved.
Above the load/deflection curve is a grouping of three separate curves marked "a", "b" and "c". These are intended to provide simple predictions of the life expectancy of the particular disc spring in dynamic loading conditions as discussed in Chapter 8.2. The curves "a", "b" and "c" relate to the theoretical life expectancies of 100,000, 500,000 and 2 million life cycles. A significant number of these curves have a slight "bending" in their form which is due to a change from σII, to σIII, as the critical stress during deflection (see Section 8.2.2).
Life Prediction from the Graphs (Fig. 35)35)
With a pre-load deflection of 0.05 mm, the spring load is 98.54 Newtons. At a deflection of 0.15 mm, the equivalent load is 268.1 Newtons.
Projecting vertically from the bottom load point to the upper load point and then horizontally across the chart towards the left hand side, the two resulting lines will intersect at a point which is located between curve "b" and curve "c"; this will indicate a theoretical life expectancy of between 500,000 and 2 million cycles. If the disc spring is used with an initial spring deflection of 0.05 mm and a final spring travel of 0.15 mm, as discussed above, the lines will intersect at a life expectancy value of about 700,000 cycles.
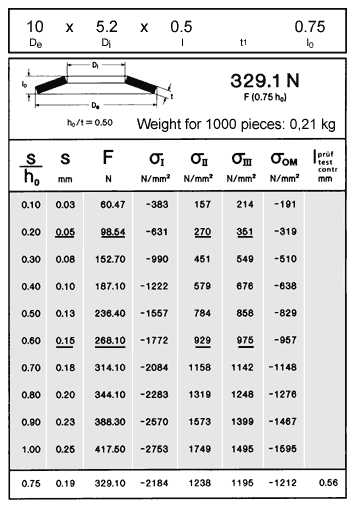
Figure 36
Example
The heading of the right hand portion of the table gives the disc spring's dimensions, below which are: a rudimentary cross-sectional representation of the particular disc spring, the characteristic load/deflection curve data based on the curve parameter ho/t or K4 · (h'o/t'), the test load at 75 % deflection F(s = 0.75 ho) and the weight per 1,000 pieces.
The ta b les were des igned to assist those i nd ividu a ls who prefer to work with numeric values as opposed to graphs.
The loads and the stresses for the cross- sectional points Sigma I, II, III and OM have been tabulated for ten points along the load/deflection curve. The bottom-most data point s = 0.75 ho was calculated in an analog manner to provide the test load associated with the DIN 2093 test height ITEST for the spring (see Section 11.1.1).
Life Predictions from the Tables (Figure 36) (Figure 36)
The spring deflection and load at both pre-load and final-load have been outlined as in the example on the graph Figure 35. The stress range from pre-load to final-load at Sigma II on the disc spring cross-section is +270 to + 929 N/mm2, while the at Sigma III ranges from +351 to +975 N/mm2 for the same preload to final-load values. These values indicate an approximate life expectancy of 700,000 cycles (see Section 8.2.3).
Mechanical Properties
All tables which have been shown in this chapter have been calculated with a Modulus of Elasticity of 206,000 N/mm2 and a Poisson Factor, µ of 0.30.


